Introduction of biodiversity index
Posted by AaronClausen
17 Aug 2023
Hi everyone,
We are trialling a new concept called the biodiversity index.
The biodiversity index is a weighted score that provides an indicative value as to the general biodiversity of a given location.
The higher the number of threatened, rare and/or native species within a location, the higher it's biodiversity index will be.
Reporting more sightings of a species that already exists within a location will not influence its biodiversity index.
The biodiversity index for a given location is calculated by:
SUM ( weighted index of each species recorded at the location )
- Threatened and rare species attract the highest weighted index
- Native species attract a high weighted index
- Exotic and cosmopolitan species attract a low biodiversity index but still contribute a point
This is an initial attempt, or a starting point, to provide a consistent way to measure the biodiversity across different locations.
And I am certain that we won't have got it right first go.
The algorithm and weighted score used to calculate the biodiversity for each location is definitely open to feedback and improvement - but this is a starting point.
We are keen to see how it holds up and the kind of feedback that we get about this new feature.
Please comment below and let us know what you think!
What can we do with it?
The biodiversity index can provide a general indication that a location may either:
- Be data deficient and therefore need people to report more sightings; OR
- Be genuinely low in biodiversity and potentially a good candidate for regenerative or restorative efforts
We would like to measure the change in a location's biodiversity index over time (both good and bad).
Examples
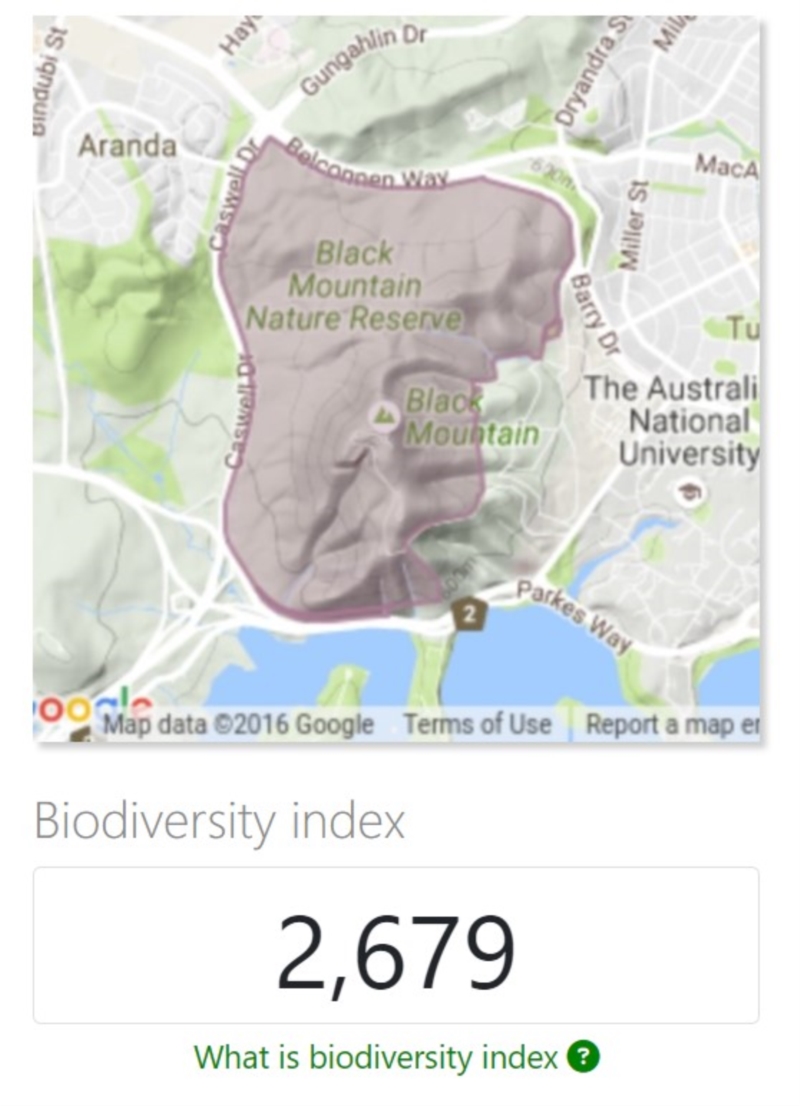
With 78 species of native orchids, open forest, woodland and grassland reserve, Black Mountain, has an extremely high biodiversity index:
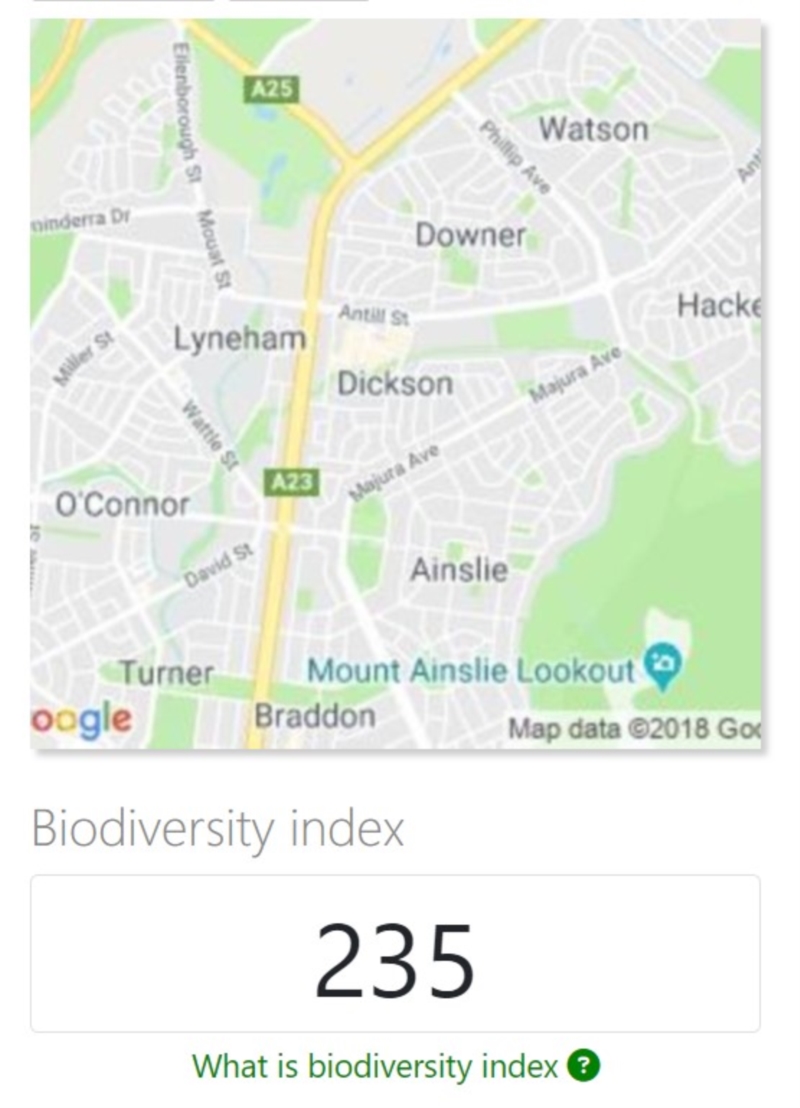
In contrast, an urban area such as Dickson, ACT, carries a much lower biodiversity index:
31 comments
Thanks @AndyRoo - yep I think we will be able to expand with more detailed info on how the calculation is made.
We are also working on a visual representation kind of like a spectrum, that will show the breakdown of species within each location to help visualise it a bit better.
re: what constitutes a given location - these are simply the existing locations (maps and places) that already exist in NatureMapr that we have a polygon or Google suburb definition of.
- Don't display for places
- Provide an improved breakdown of value / calculation for each location
Be genuinely low in biodiversity and potentially a good candidate for regenerative or restorative efforts", a low index may simply indicate paucity of data. So I would like to see two indices - one for data intensity and one for biodiversity - presented together somehow. These could be either two measures side by side or there could probably be a confidence measure attached to the biodiversity index and displayed accordingly, e.h.g., colour is biodiversity, size of dot or intensity of colour reflects confidence.
We are working on a visual spectrum style diagram next to show the breakdown and will continue to play with this feature based on user feedback like yours.
Is there an inverse weighting for land area? Or does the index get bigger as more places are aggregated into one? It would be interesting to see the biodiversity index displayed as a map of the whole region, colour-coded by the weighted sum of species per square km.
@SenexRugosus asks about land area, and in general biodiversity increases with area or different habitat such as creeks and ponds. The ACT Government has vegetation maps that might be useful but I don’t think they could be used with Google.
I think the biodiversity index is a great idea. I’m not sure about adding anything for non indigenous plants. I would like to see a biodiversity index for only plants that are indigenous to the location.
The biodiversity index as currently proposed appears to be focussed on native species richness (and possibly abundance) and threatened species. However, in practice when assessing the biodiversity value of a site there are a multiplicity of other factors (which I won't list here) that are required to be taken into consideration, some of which have been touched on in the various comments above. These many factors aren't captured in NatureMapr and it would probably be impractical to do so given the additional levels complexity and effort it would introduce for the software and admin teams and given the additional levels of contributor effort, knowledge, and data access that would be required. Therefore, I would also suggest that the name of the biodiversity index should also better reflect that it is only capturing one or a few elements of site biodiversity value, even if in many instances these may be the most significant for conservation protection and management purposes. For starters, here are four suggestions:
*Native species biodiversity index
*Native species richness index
*Native species value index
*Native species diversity index
Thanks for the fantastic and energetic feedback on this.
We have removed the biodiversity index from Places (E.g. Dickson, ACT) and from Survey Points.
So the index will now only be displayed for Maps (aka polygons).
We will soon look to introduce some kind of measurement of the density and coverage of sighting data for a given Map (polygon) to accompany the biodiversity index.
@roman_soroka - we may be able to display the index for a map search in the future - excellent idea.
@michaelb - yep hopefully another accompanying number soon to give an indication of "data saturation/density" for given map/polygon.
@eltrixo is also working on a visual spectrum style breakdown which we will release soon that will show the breakdown of species that exist within a given location.
@rainer (Rainer Rehwinkel) spent years evaluating sites for conservation purposes. His guidance in developing a good measure of biodiversity would be valuable.
As a first principle, any score, to be comparable, needs to be area-constrained. It would be very difficult to have a meaningful comparison between, say, a large megadiverse site like Black Mountain, with a small site such as, say, the small grassland site at Reservoir Hill at Lawson. Also, the amount of effort in gaining information about a site is important. To be meaningful, each score for a site needs to have an indication as to how much survey effort has been expended and the area that has been covered.
Also important is the idea that it is not just species richness that is important, but the bigger concept of “diversity”. Two sites may have the same species richness (i.e., the same number of species) but differ in diversity, by the fact that in one site, lets say of the ten species present, one species dominates and the other species are all rare, while in the second site, each of the ten species are more or less equally common. The second site is said to be more diverse.
These are factors that are built in to the FVS. Also built into this system is the idea that some species are rarer than others. Such species are weighted higher and contribute a greater amount to the final score for each plot.
The biodiversity index for a given location is calculated by:
SUM ( weighted index of each species recorded at the location )
Threatened and rare species attract the highest weighted index
Native species attract a high weighted index
Exotic and cosmopolitan species attract a low biodiversity index but still contribute a point
So, a score each for the following:
1. Number of threatened species
2. Total number of indigenous species
3. Total number of exotic and non-indigenous native species.
Additional information could be derived by dividing each of the above by the area of the in ha site to give an average for comparison purposes. These measures still do not take into account survey effort.